Forex Live Heat Map |
Market Comments |
Technical Indicator Signals |
Cross Pair Rates
| Live Spread
| Live Charts
| Daily Pivot Points
RSI Forex Trading Strategy with Support & Resistance Level
Last Update: 20 January,2017RSI is popular indicator used for both day trading and scalping. This profitable strategy is made with support and resistance. RSI gives reversal signals from support and resistance level. New traders can use this strategy for scalping purpose on lower time frame.
Required Indicator:
1. RSI Click here for RSI indicator setup process2. You should know basic knowledge of support, resistance level. Read below articles to know how to draw and use support & resistance level.
How to Identify & Implement Support and Resistance Levels?
5 Simple Rules to Plot Perfect Support and Resistance Price Levels
9 Points to Remember while using Support and Resistance Price Levels
Buy Entry Setup Rules:
★ First draw support level correctly according to above article rules.★ Need to find major support level
★ You have to wait for price to come on the support level and wait for strong pull back.
★ Need to formed reversal bullish candle (such as pin bar, bullish engulfing or an others reversal bullish candles) on that support level.
★ At the same time, RSI needs to cross 35 level from upper to lower.
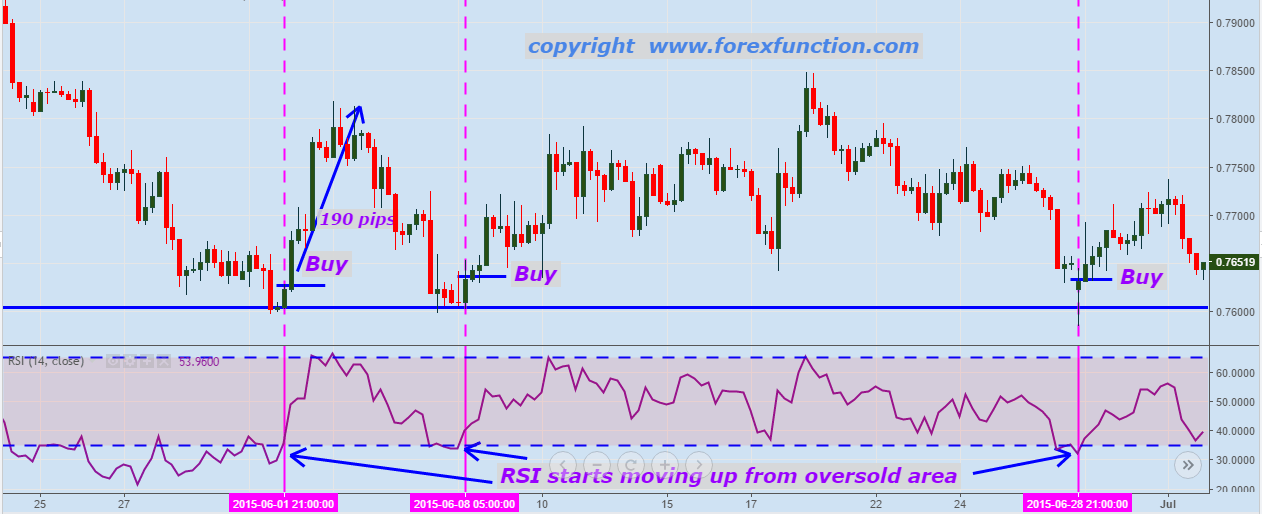
★ If RSI starts moving up towards upside from oversold area, then it indicates buy signals.
Example of Buy Setup:

In the above example, we can see, market price returned from support level and formed bullish reversal candle on the first setup. At the same time, RSI started upside movement from oversold area which indicates buy signal according to this strategy. 190 pips was gained from that setup. Second and third setup was also profitable in the above example..
Sell Entry Setup Rules:
★ First draw resistance level correctly according to above article rules.★ Need to find major resistance level.
★ You have to wait for price to come on the resistance level and wait for strong pull back.
★ Need to formed reversal bearish candle (such as pin bar, bearish engulfing or an others reversal bearish candles) on that resistance level.
★ At the same time, RSI needs to cross 65 level from upper to lower
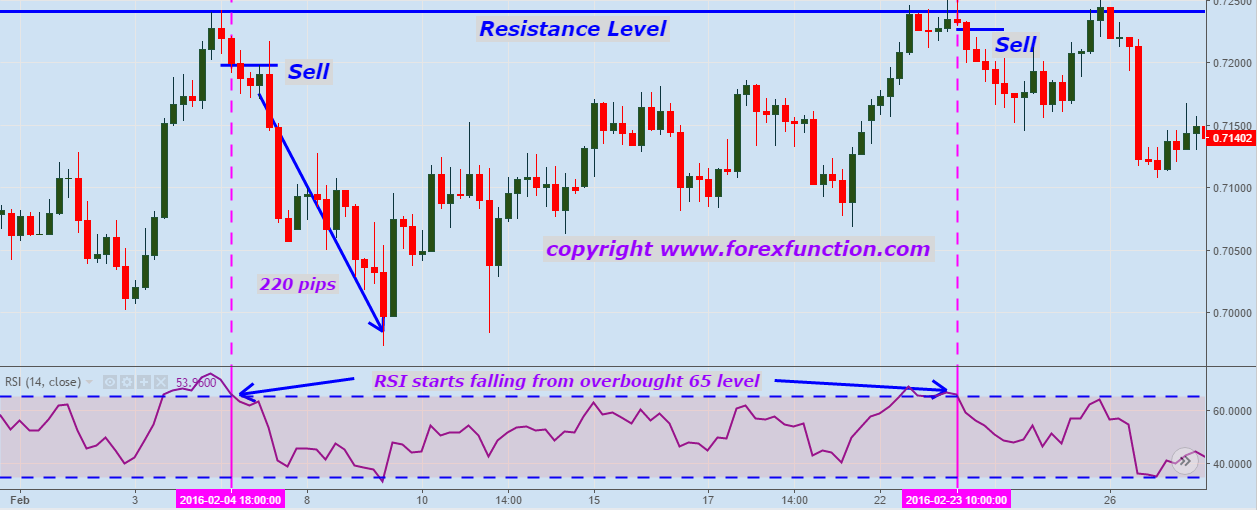
★ If RSI starts moving down towards downside from overbought area, then it indicates sell signals.
Example of Sell Setup:

In the above example, we can see that market price touched resistance level and formed bearish reversal pattern and RSI also started movement towards downside from overbought area. 220 pips was profit from first setup and other setup was also profitable according this simple support & resistance trading strategy.
Time frame:
AnyCurrency pairs:
All pairs.Take profit and stop loss:
Take profit can be higher for H4, for H1 or below, you can set 25-100 pips.Stop loss should be set as 25-60 pips. You can set Stop loss on swing high or low.
Risk warning:
This forex strategy can be only profitable when you can draw support & resistance properly. If you can follow the rules, then you can do well from this strategy. Remember one thing, you must follow money management rules while following this strategy on demo or live account.Submit Your Comments:
FOREX VPS FOR TRADERS
FF FOREX VPS
Windows 2012R2/2016 | Server Location Amsterdam, France, Canada | Low Latency From Brokers| Super Fast Trading Experience | All types of EA supported | 3 Days Money Back Guarantee
| Plan Name | Buy Link | CPU | RAM | Disk | BandWidth | Price (Montly) | Price (Quarterly) | Price (Semi-Annually ) | Price (Annually) | Installation | BackUp | Setup Fee |
| ECO-01 | buy now | 1 Core | 756MB | 18GB | Unmetered | $4.99/M | $4.49/M | $3.99/M | $2.99/M | MT4 Pre-Installed | Yes | Free |
| ECO-02 | buy now | 1 Core | 1GB | 22GB | Unmetered | $5.99/M | $5.49/M | $4.99/M | $3.99/M | MT4 Pre-Installed | Yes | Free |
| ECO-03 | buy now | 2 Core | 2GB | 30GB | Unmetered | $9.99/M | $9.49/M | $8.99/M | $7.99/M | MT4 Pre-Installed | Yes | Free |
| ECO-04 | buy now | 2 Core | 3GB | 32GB | Unmetered | $13.99/M | $13.49/M | $12.99/M | $11.99/M | MT4 Pre-Installed | Yes | Free |
| ECO-05 | buy now | 3 Core | 4GB | 40GB | Unmetered | $17.99/M | $17.49/M | $16.99/M | $15.99/M | MT4 Pre-Installed | Yes | Free |
| ECO-06 | buy now | 3 Core | 5GB | 45GB | Unmetered | $21.99/M | $21.49/M | $20.99/M | $19.99/M | MT4 Pre-Installed | Yes | Free |
***We accept Paypal, Perfect Money, Bitcoin !


