Forex Live Heat Map |
Market Comments |
Technical Indicator Signals |
Cross Pair Rates
| Live Spread
| Live Charts
| Daily Pivot Points
Understanding Trend Lines & How to Draw & Use them Correctly?
Last Update: 17 December,2016The Significance of the Trend Lines
A forex trader can only profit from the market if there is any movement in the price of a currency pair i.e. whether it would be upward, downward or sideways. The term “Trend” in technical analysis means, the price moving in a single direction, and the term “Trend Lines” means, a line drawn on the charts by connecting a minimum of 2 major price points i.e. swing high’s or swing low’s, in order to define the current trend and support or resistance price levels of the currency pair.You might be thinking as why there is a need to draw a trend line as we can see the trend with bare eyes?
Well, the answer is trend lines are the most important part of technical analysis and are also used by many forex traders. A trend line gives the confirmation of the continuing trend and helps us in identifying the price action as if there is any possible breakout and/or whether the price has started to move in another direction, further trend lines helps in determining the good entry and exit points, and also as where we should place our stop loss order and what is the potentially best price to book profits.
There are 3 Types of Trends and as so We Can Draw 3 Types of Trend Lines
1. Up Trend – Trend line is drawn by connecting higher swing low’s.
2. Down Trend – Trend line is drawn by connecting lower swing high’s.
3. Sideways Trend (Channeling) – Trend line is drawn by connecting swing high’s and swing low’s.
So, now you know the power of a trend line, but let me tell you one thing, drawing trend lines is very subjective and they should be used as a tool in your trading strategy if used alone they won’t be able to help you in making pips.
How to Draw a Correct Trend Line on Forex Charts?
Trend lines can be drawn on all types of trends. The basic requirement to draw a trend line is that there should be a minimum of 2 price action swings i.e. a minimum of 2 high tops and/or 2 low bottoms also known as peaks and valleys, after that it is very simple, just connect those two price points with a ray. You will get the result as a trend line indicating the future possibility of support and/or resistance price levels.Trend lines are further drawn on all time frames ranging from monthly to as small as intraday 5 minutes in order to indicate the trends, as what are the long term, medium term and short term trend of a currency pair?
Now let’s see all the 3 Types of Trend Lines
1. Bullish Trend Line (Up Trend)
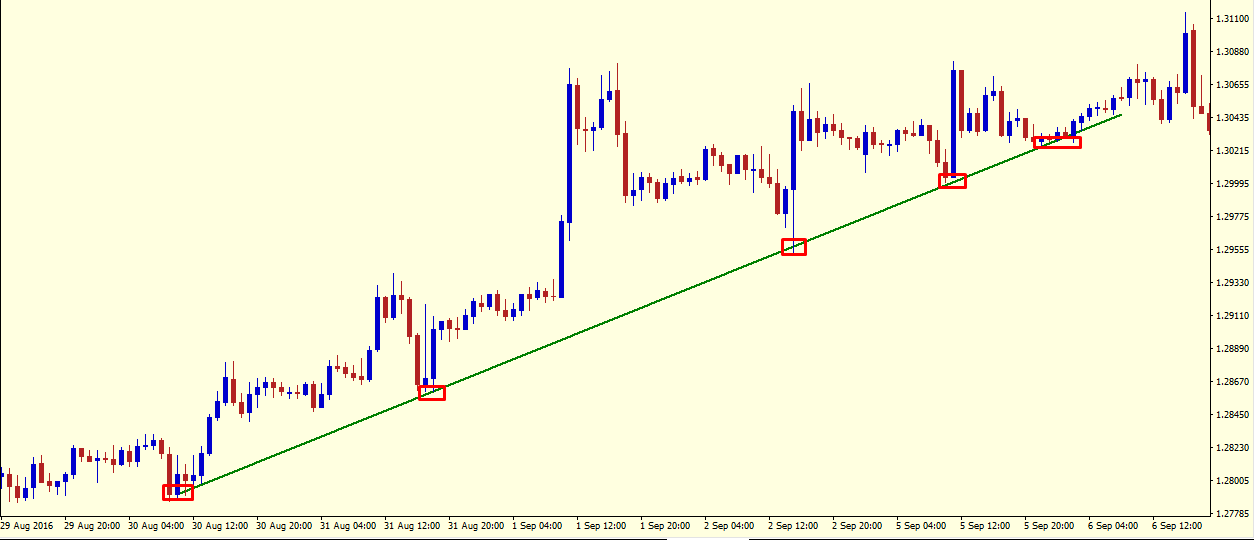
Example of Bullish Trend Line

An upward trend line is drawn when the price of any currency pair is rising. Once a currency pair has completed two bullish price swings, we can easily plot a trend line by simply connecting the price of higher swing lows. Make sure, that the trend line is diagonal i.e., not too straight horizontally and also not too steep vertically.
2. Bearish Trend Line (Down Trend)
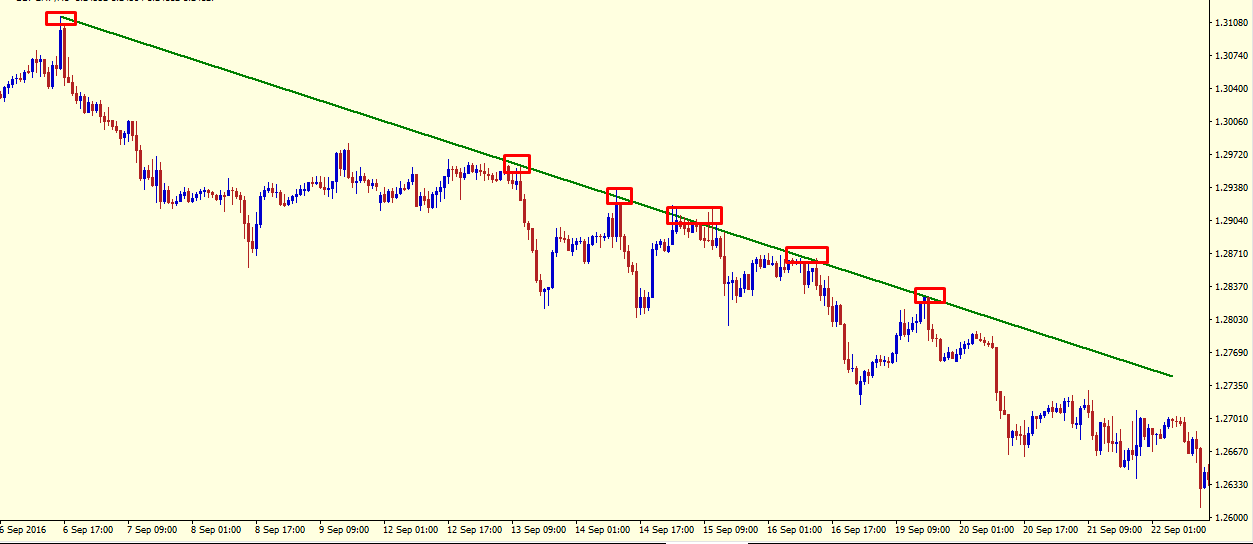
Example of Bearish Trend Line

A downward trend line is drawn when the price of any currency pair is declining. Once a currency pair has completed two bearish price swings, we can easily plot a trend line by simply connecting the price of higher swing lows. Make sure, that the trend line is diagonal i.e., not too straight horizontally and also not too steep vertically.
3. Side to Side Trend Line (Channel Ranging Sideways)
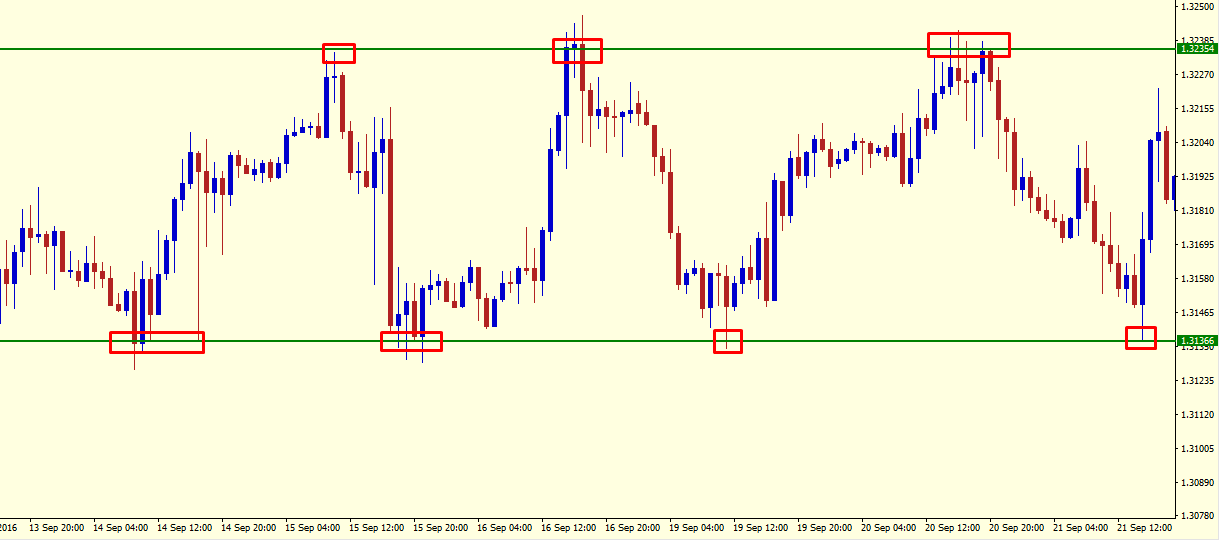
Example of Sideways Trend Line

A sideways trend line is drawn when the price moves in a fixed range i.e. when price moves inside a box, repeating to make similar high’s and low’s. Once a currency pair has completed two price swings with approximately similar high’s and low’s, we can easily plot a straight horizontal trend line by simply connecting the price of swing high’s and swing low’s.
A couple of Important Facts (Secrets) about Trend Lines
• A trend line is always drawn from the left side to the right side.
• The more straight (horizontal) or steeper (vertical) trend line you will draw for a bullish and/or bearish trend, it is going to be less reliable and will quickly result in a breakout.
• By continuously increasing number of times a trend line is tested, it becomes more important and stronger.
• Prices may sometimes penetrate, but they should not close in the opposite direction of the trend line i.e. the price should not intersect (cut across).
• Do not ever try to plot a trend line by adjusting it according to the market prices. An adjusted trend line is not a valid trend line.
Conclusion
A trend line offers great insight if they are drawn correctly, but if not, then they may produce false signals. Trend lines should be used as a tool in our trading strategy in order to filter and confirm a trade setup. The more you’ll practice, the more you’ll master the art of drawing the correct trend lines.Submit Your Comments:
FOREX VPS FOR TRADERS
FF FOREX VPS
Windows 2012R2/2016 | Server Location Amsterdam, France, Canada | Low Latency From Brokers| Super Fast Trading Experience | All types of EA supported | 3 Days Money Back Guarantee
| Plan Name | Buy Link | CPU | RAM | Disk | BandWidth | Price (Montly) | Price (Quarterly) | Price (Semi-Annually ) | Price (Annually) | Installation | BackUp | Setup Fee |
| ECO-01 | buy now | 1 Core | 756MB | 18GB | Unmetered | $4.99/M | $4.49/M | $3.99/M | $2.99/M | MT4 Pre-Installed | Yes | Free |
| ECO-02 | buy now | 1 Core | 1GB | 22GB | Unmetered | $5.99/M | $5.49/M | $4.99/M | $3.99/M | MT4 Pre-Installed | Yes | Free |
| ECO-03 | buy now | 2 Core | 2GB | 30GB | Unmetered | $9.99/M | $9.49/M | $8.99/M | $7.99/M | MT4 Pre-Installed | Yes | Free |
| ECO-04 | buy now | 2 Core | 3GB | 32GB | Unmetered | $13.99/M | $13.49/M | $12.99/M | $11.99/M | MT4 Pre-Installed | Yes | Free |
| ECO-05 | buy now | 3 Core | 4GB | 40GB | Unmetered | $17.99/M | $17.49/M | $16.99/M | $15.99/M | MT4 Pre-Installed | Yes | Free |
| ECO-06 | buy now | 3 Core | 5GB | 45GB | Unmetered | $21.99/M | $21.49/M | $20.99/M | $19.99/M | MT4 Pre-Installed | Yes | Free |
***We accept Paypal, Perfect Money, Bitcoin !


