Solo Candlestick Patterns
Last Update: 20 December,2016Yup, as the name reflects, today we will go through solo candlestick patterns i.e. Single Candlestick Patterns , these single candlestick patterns are an important tool to analyze the price action for any currency pair because it gives us an edge by providing the price action information very quickly within a single candlestick rather than lagging.
There are various different names for all candlestick patterns, but basically the idea behind all candlestick patterns is the same i.e. the more is the real body, the more is the strength of a particular trend and the more is the shadow, the more is the indecision in the forex market because a shadow is the result of bulls and bears fighting and ending up into a draw or a tie.
Single candlestick patterns are basically one of the best technically analyzing tools because they accurately and immediately reflect the forex market’s indecision and/or a reversal of the current trend, the most important single candlestick patterns are as following
Hammer and Hanging Man
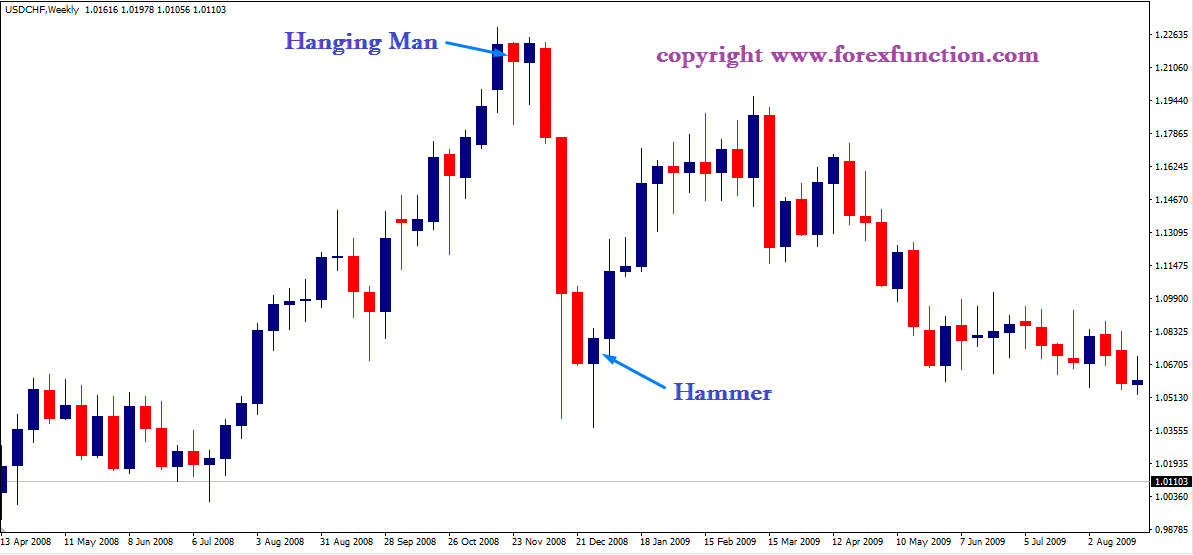
The Hammer and Hanging Man are similar in terms of appearance because both of them have the same type of physical appearance i.e. tiny real bodies at the top, long lower shadows and a little or no upper shadow, but their role is absolutely opposite depending on the historical price action.Example of Hammer and Hanging Man Candle Pattern

Hammer
The illustration above shows the formation of a Hammer. The hammer is a bottom reversal candlestick pattern i.e. a candlestick, which is formed in a down trending forex market.The Hammer has a small real body at the top, or the real body is just a little lower from the high of a candlestick, and the size of the lower shadow is approximately more than the double size of the real body, the more is the length of lower shadow, the more is the hammer candlestick pattern powerful.
The color of a Hammer is not important because a hammer reflects the bullish market sentiment i.e. a long lower shadow provides the market information that the bulls are now becoming stronger and are getting ready to take the lead.
If a Hammer is formed after the price has been declining continuously, it means that the bears have tried their best in pulling the prices lower, but due to some reason bulls have reacted strongly, as a result, bulls have pushed the prices higher from lower levels of the candlestick, such interpretation gives a clear vision of the market i.e. the demand is now increasing, as a result, the buying pressure has made the market closed at a higher level and due to the loss of momentum in selling pressure, a potential reversal and/or market indecision might result the prices to move in a opposite or sideways direction.
The Basic Criteria for Identifying a Hammer Candlestick Pattern
The real body is at the top of the candlestick.
There should be no upper shadow, but a tiny upper shadow is acceptable.
The lower shadow should be more than double in size of the real body. The longer is the length of lower shadow; the more are the bulls powerful.
Color of a hammer is not important, but a white color is more powerful than the black color.
Hanging Man
The illustration above shows the formation of a Hanging Man. The hanging man is a top reversal candlestick pattern i.e. a candlestick pattern, which is formed in an up trending forex market.The Hanging Man has a small real body at the top, or the real body is just a little lower from the high of a candlestick, and the size of the lower shadow is approximately more than the double size of the real body, the more is the length of lower shadow, the more is the hanging man candlestick pattern powerful.
The color of Hanging Man is not important because a hanging man reflects the bearish market sentiment i.e. a long lower shadow provides the market information that the bears are now becoming stronger and are getting ready to take the lead.
If a Hanging Man is formed after the price has been appreciating continuously, it means that due to some reason bears have reacted strongly and pulled the prices lower, but finally bulls have managed to push prices higher, but only up to the level of nearby opening price i.e. if the price has to appreciate and continue being bullish then it requires a buying pressure, but as a hanging man is reflecting a loss of momentum in buying pressure, a potential reversal and/or market indecision might result the prices to move in a opposite or sideways direction.
The Basic Criteria for Identifying a Hanging Man Candlestick Pattern
The real body is at the top of the candlestick.
There should be no upper shadow, but a tiny upper shadow is acceptable.
The lower shadow should be more than double in size of the real body. The longer is the length of lower shadow; the more are the bears powerful.
Color of the hanging man is not important, but a black color is more powerful than the white color.
Inverted Hammer and Shooting Star
The Inverted Hammer and Shooting Star are similar in terms of appearance because both of them have the same type of physical appearance i.e. tiny real bodies at the bottom, long upper shadows and a little or no lower shadow, but their role is absolutely opposite depending on the historical price action.Inverted Hammer

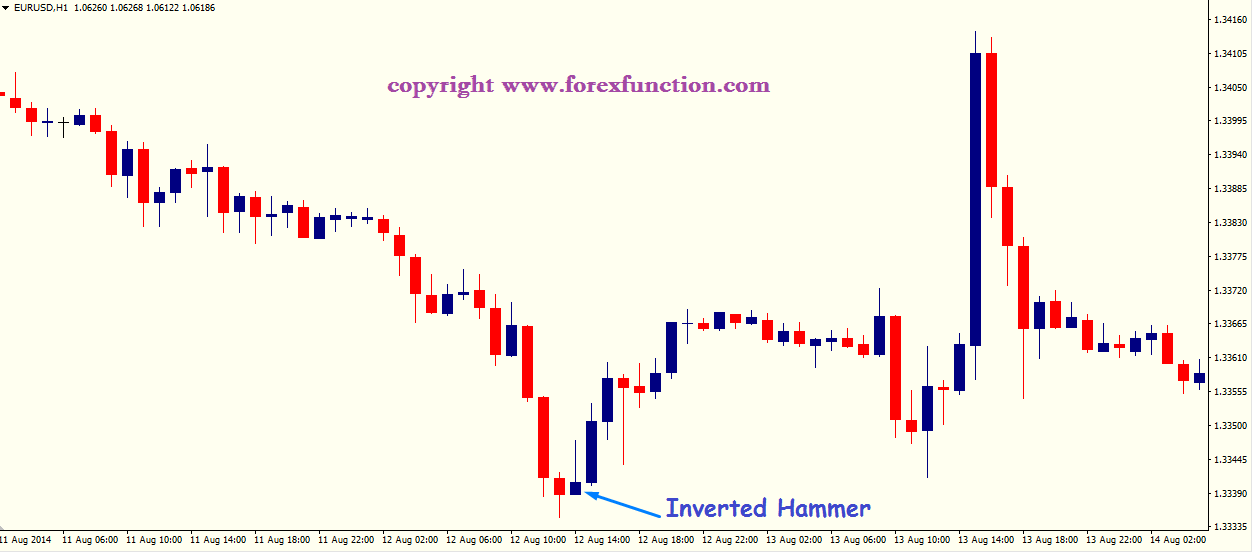
The illustration above shows the formation of an Inverted Hammer. The inverted hammer is a bottom reversal candlestick pattern i.e. a candlestick pattern, which is formed in a down trending forex market.
The Inverted Hammer has a small real body at the bottom, or the real body is just a little higher from the low of a candlestick, and the size of the upper shadow is approximately more than the double size of the real body, the more is the length of upper shadow, the more is the inverted hammer candlestick pattern powerful.
The color of Inverted Hammer is not important because an inverted hammer reflects the bullish market sentiment i.e. a long upper shadow provides the market information that the bulls are now becoming stronger and are getting ready to take the lead.
If an Inverted Hammer is formed after the price has been declining continuously, it means that due to some reason bulls have reacted strongly and pushed the prices higher, but finally bears have managed to pull prices lower, but only up to the level of nearby opening price i.e. if the price has to decline and continue being bearish then it requires a selling pressure, but as an inverted hammer is reflecting a loss of momentum in selling pressure, a potential reversal and/or market indecision might result the prices to move in a opposite or sideways direction.
The Basic Criteria for Identifying an Inverted Hammer Candlestick Pattern
The real body is at the bottom of the candlestick.
There should be no lower shadow, but a tiny lower shadow is acceptable.
The upper shadow should be more than double in size of the real body. The longer is the length of upper shadow; the more are the bulls powerful.
Color of the Inverted Hammer is not important, but a white color is more powerful than the black color.
Shooting Star

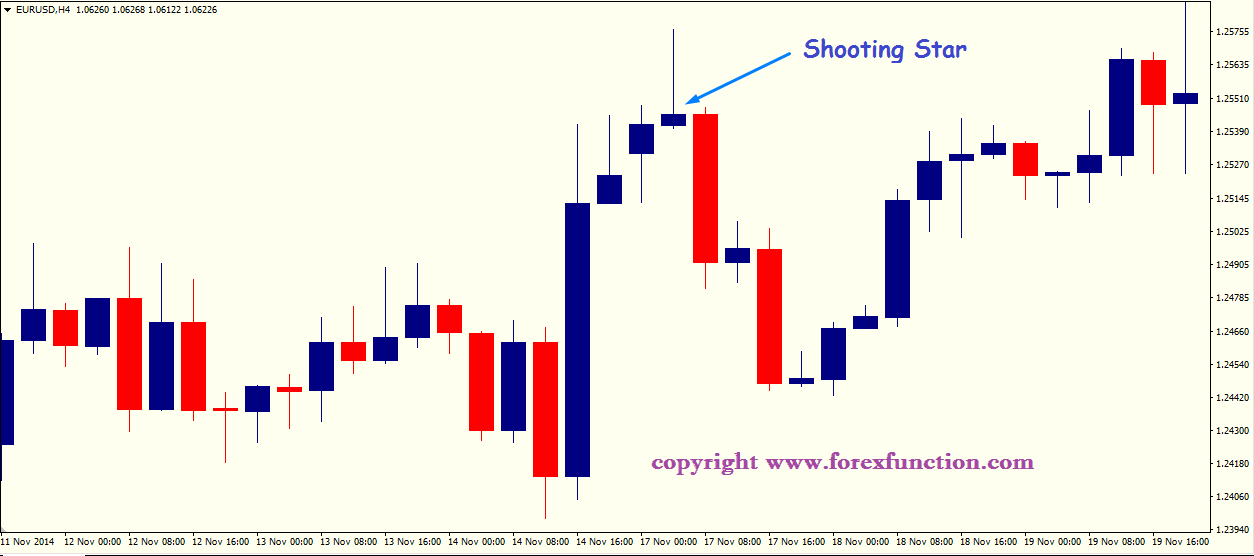
The illustration above shows the formation of a Shooting Star. The shooting star is a top reversal candlestick pattern i.e. a candlestick, which is formed in an up trending forex market.
The Shooting Star has a small real body at the bottom, or the real body is just a little higher from the low of a candlestick, and the size of the upper shadow is approximately more than the double size of the real body, the more is the length of upper shadow, the more is the shooting star candlestick pattern powerful.
The color of a Shooting Star is not important because a shooting star reflects the bearish market sentiment i.e. a long upper shadow provides the market information that the bears are now becoming stronger and are getting ready to take the lead.
If a Shooting Star is formed after the price has been appreciating continuously, it means that the bulls have tried their best in pushing the prices higher, but due to some reason bears have reacted strongly, as a result, bears have pulled the price lower from higher levels of the candlestick; such interpretation gives a clear vision of the market i.e. the demand is now decreasing, as a result, the selling pressure has made the market closed at a lower level and due to the loss of momentum in buying pressure, a potential reversal and/or market indecision might result the prices to move in a opposite or sideways direction.
The Basic Criteria for Identifying a Shooting Star Candlestick Pattern
The real body is at the bottom of the candlestick.
There should be no lower shadow, but a tiny lower shadow is acceptable.
The upper shadow should be more than double in size of the real body. The longer is the length of upper shadow; the more are the bears powerful.
Color of the Shooting Star is not important, but a black color is more powerful than the white color.
Kindly remember in the above illustrations, all candlestick patterns were eligible for trading because they were confirmed by an opposite direction trending candlestick before entering the trade, as a result, the trade was successful because price respected the hammer, hanging man, inverted hammer and shooting star by moving in the appropriate direction.
Cautionary Words
Now this does not mean that every time you see a single candlestick pattern, you should trade it, because doing such a thing would be gambling, but in order to profit from a candlestick pattern, it is recommended to wait for the price confirmation in order to take calculated low risks for higher profits i.e. let the bulls and bears show their power by pushing or pulling the prices, as a result, by showing a price confirmation candlestick after every candlestick pattern and also remember, the price should not make a fresh high or low than the high or low of every respective candlestick pattern before opening a position, if it does, then the candlestick pattern is not powerful enough for leading the prices.Conclusion
Kindly remember, all candlestick patterns are very useful and should be used as a tool for confirmation of a trade setup with your personal trading strategy. A single candlestick and all candlestick patterns provide the best possible probabilities for speculating the future price movement and also we are able to achieve miraculous rewards while trading forex if they are properly used in context i.e. if any single candlestick and/or all candlestick patterns is formed at a support and resistance levels; we get a double price confirmation and hence we are able to profit from a low risk trading opportunity to reap huge profits.Submit Your Comments:
FOREX VPS FOR TRADERS
FF FOREX VPS
Windows 2012R2/2016 | Server Location Amsterdam, France, Canada | Low Latency From Brokers| Super Fast Trading Experience | All types of EA supported | 3 Days Money Back Guarantee
| Plan Name | Buy Link | CPU | RAM | Disk | BandWidth | Price (Montly) | Price (Quarterly) | Price (Semi-Annually ) | Price (Annually) | Installation | BackUp | Setup Fee |
| ECO-01 | buy now | 1 Core | 756MB | 18GB | Unmetered | $4.99/M | $4.49/M | $3.99/M | $2.99/M | MT4 Pre-Installed | Yes | Free |
| ECO-02 | buy now | 1 Core | 1GB | 22GB | Unmetered | $5.99/M | $5.49/M | $4.99/M | $3.99/M | MT4 Pre-Installed | Yes | Free |
| ECO-03 | buy now | 2 Core | 2GB | 30GB | Unmetered | $9.99/M | $9.49/M | $8.99/M | $7.99/M | MT4 Pre-Installed | Yes | Free |
| ECO-04 | buy now | 2 Core | 3GB | 32GB | Unmetered | $13.99/M | $13.49/M | $12.99/M | $11.99/M | MT4 Pre-Installed | Yes | Free |
| ECO-05 | buy now | 3 Core | 4GB | 40GB | Unmetered | $17.99/M | $17.49/M | $16.99/M | $15.99/M | MT4 Pre-Installed | Yes | Free |
| ECO-06 | buy now | 3 Core | 5GB | 45GB | Unmetered | $21.99/M | $21.49/M | $20.99/M | $19.99/M | MT4 Pre-Installed | Yes | Free |
***We accept Paypal, Perfect Money, Bitcoin !


