Forex chart pattern trading on Wedge Pattern
Last Update: 16 November,2014Wedge pattern
The wedge pattern is one of the common chart pattern in the technical analysis. This pattern is used mainly as reversal pattern. Sometimes it can indicate continuation of any trend. Wedge pattern is like as channel pattern but there is some difference between these patterns. In channel, price rally in parallel way, in wedge, price comes close at the end of this pattern.
bWedge patterns are two types:
1. Rising wedge pattern
2. Falling wedge pattern
Rising wedge pattern
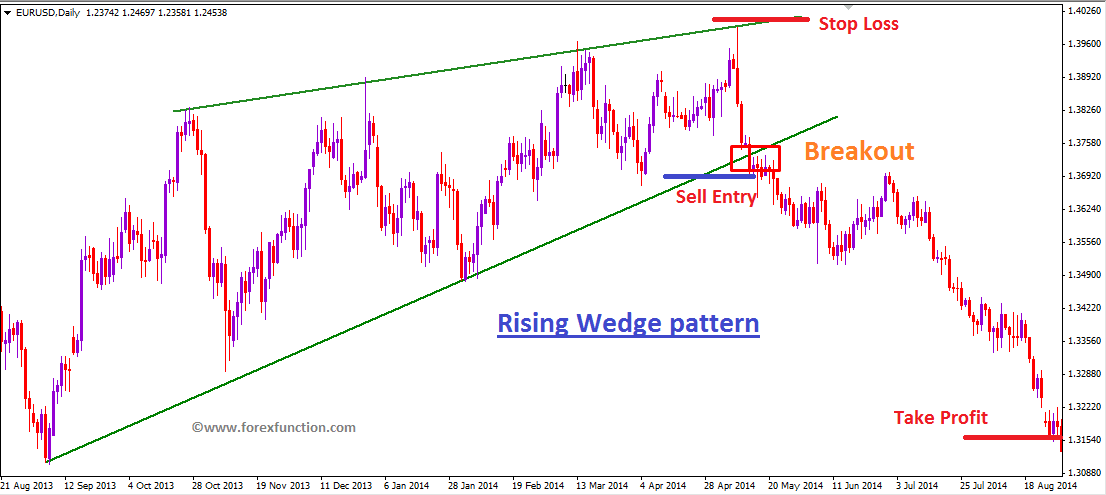
Rising wedge pattern is found in the uptrend market. It is used as reversal pattern which gives bearish signal. This pattern is made by two rising trend line.
How it forms:
>> It occurs on at the top of the market.
>> It makes higher highs and higher lows.
>> Price movement becomes slow.
>>Price comes closer at the top of this pattern.
>>It combined with two rising trend lines.
>>Upward momentum becomes slow.

How to trade on rising wedge pattern:
When price momentum becomes slow then sellers take preparation for getting sell confirmation. Bearish signal comes when price breaks lower rising trend line. Breakout of this pattern can be confirmed by volume indicator. After successful breakout it indicates for bearish signal. Success rate is very high in this pattern. Take profit can be set as 1:3 risk ratio. Stop loss need to set above the top of this pattern.
Falling wedge pattern
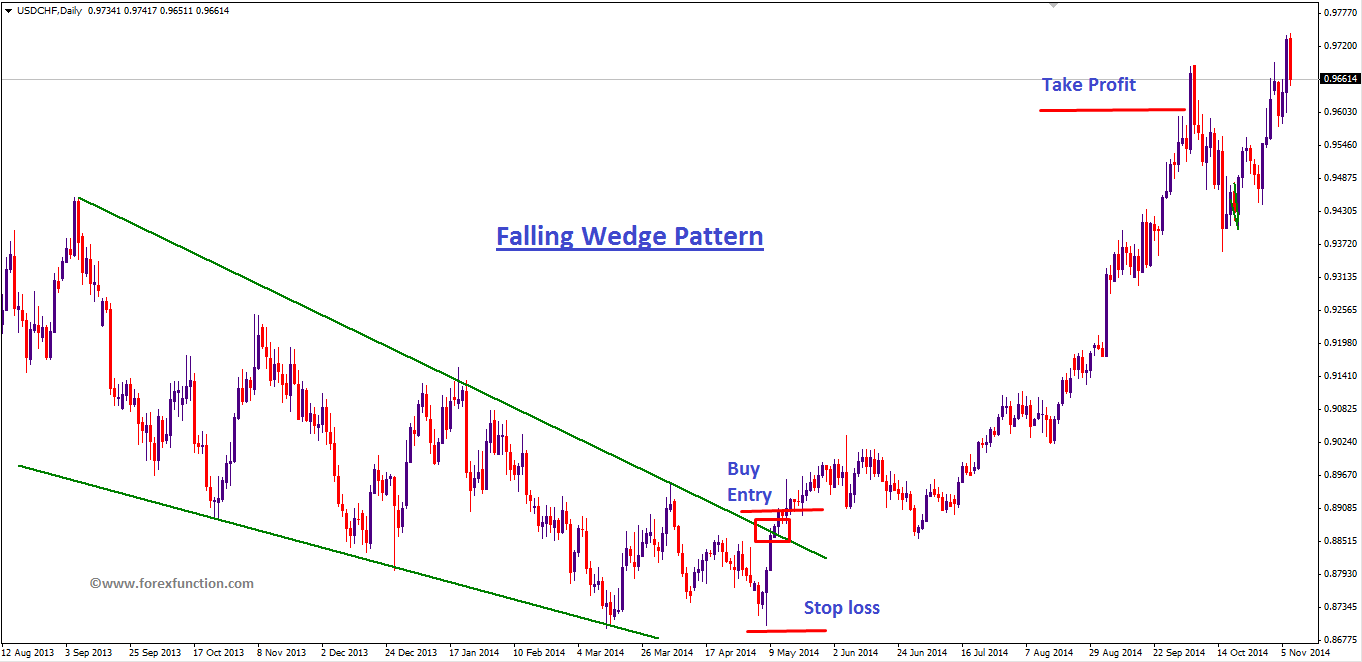
Falling wedge pattern is usually found in the downward market. It is normally used as reversal pattern which gives bullish signal. This pattern is made by two downward trend line.
How it forms:
>> It occurs on at the low of the downward market
>> It makes lower lows and lower highs for 2-3 times.
>> Price rally becomes slow at the end of the pattern.
>> Price comes closer at the low of this pattern.
>> It combined with two downward trend lines.
>> Downward momentum becomes slow.

How to trade on falling wedge pattern:
When price momentum becomes slow at the end of this pattern, market tries to go up. Bullish signal comes when price breaks upper trend line. After successful breakout it indicates for bullish signal. Success rate is very high in this pattern. Take profit can be set as 1:3 risk ratio. Stop loss need to set below the low of this pattern.
Submit Your Comments:
FOREX VPS FOR TRADERS
FF FOREX VPS
Windows 2012R2/2016 | Server Location Amsterdam, France, Canada | Low Latency From Brokers| Super Fast Trading Experience | All types of EA supported | 3 Days Money Back Guarantee
| Plan Name | Buy Link | CPU | RAM | Disk | BandWidth | Price (Montly) | Price (Quarterly) | Price (Semi-Annually ) | Price (Annually) | Installation | BackUp | Setup Fee |
| ECO-01 | buy now | 1 Core | 756MB | 18GB | Unmetered | $4.99/M | $4.49/M | $3.99/M | $2.99/M | MT4 Pre-Installed | Yes | Free |
| ECO-02 | buy now | 1 Core | 1GB | 22GB | Unmetered | $5.99/M | $5.49/M | $4.99/M | $3.99/M | MT4 Pre-Installed | Yes | Free |
| ECO-03 | buy now | 2 Core | 2GB | 30GB | Unmetered | $9.99/M | $9.49/M | $8.99/M | $7.99/M | MT4 Pre-Installed | Yes | Free |
| ECO-04 | buy now | 2 Core | 3GB | 32GB | Unmetered | $13.99/M | $13.49/M | $12.99/M | $11.99/M | MT4 Pre-Installed | Yes | Free |
| ECO-05 | buy now | 3 Core | 4GB | 40GB | Unmetered | $17.99/M | $17.49/M | $16.99/M | $15.99/M | MT4 Pre-Installed | Yes | Free |
| ECO-06 | buy now | 3 Core | 5GB | 45GB | Unmetered | $21.99/M | $21.49/M | $20.99/M | $19.99/M | MT4 Pre-Installed | Yes | Free |
***We accept Paypal, Perfect Money, Bitcoin !


